The Big Data Analysis Movement
By Gardella Grace | February 22, 2020
A good big data analytics prosecutor will benefit from developing a network of field experts for cross-collaboration in describing the applicant’s infrastructure.
The Big Data Analysis Movement – biologic analysis, medical device, IOT, and how to describe and claim synergistic effects on an infrastructure
The software industry has grown to touch upon an increasing number of industries, integrating into all our lives. Nearly everyone in the industrial world now owns a pocket-sized computer (“smart phone”), and governments are focusing educational budgets toward teaching software coding in the manner that foreign languages were offered in the past. Despite which side of the fence you are on regarding the patent eligibility of software innovations or whether software code ought to be freely available for communal development under open source license agreements, the increasing importance of software inventions is undeniable. As new industries add themselves to the high-tech software-enriched fold, companies have begun pursuing intellectual property protection for the new innovations developed to support the digital enrichment of traditional biological, chemical, mechanical, and human services fields.
From fuzzy logic rice cookers for preparing and maintaining perfectly cooked grains, to data-linked health monitoring devices, to self-parking automobiles, there are a myriad of applications already enjoying widespread adoption that blend traditional markets with complex and innovative software bells and whistles. Highly competitive, burgeoning markets in smart linked and driverless automobiles, data analysis-supported medical devices, and automated biologic material testing and analysis including genetic analysis, in some examples, are each gathering immense quantities of data. While household names such as Google and Facebook are well known for analyzing and learning from collected data pools, historically non-tech industries are now beginning to mine and utilize their collected data to provide value-added features to customers as well as to identify areas of need for pursuing new innovations in the future.
Patent practitioners accustomed to prosecuting inventions in the traditional mechanical, life sciences, and medical device industries will soon be faced with the challenge of describing and patenting data-enriched collection and analysis infrastructures, such as Internet of Things (IoT) networked devices, smart medical devices, and big data analysis of genome pools. Patent professionals need to develop disclosure strategies and claiming strategies that go beyond the realm of traditional software-knowledgeable practitioners steeped in the traditional view of software encompassed on a disk or at a server. The far greater challenge to today’s IP protectors of big data collection and analysis is to consider the questions of a good detective – who, what, when, where and why – in an effort to describe and claim aspects of the infrastructure in a manner that is implementation agnostic in the realms of time and space. In other words, beyond the traditional “how” focus of describing the functionality of new inventions, the cooperative, parallel processing used in modern big data collection and analysis infrastructures requires new drafting strategies to achieve holistic protection within the potential environments in which the inventions could function.
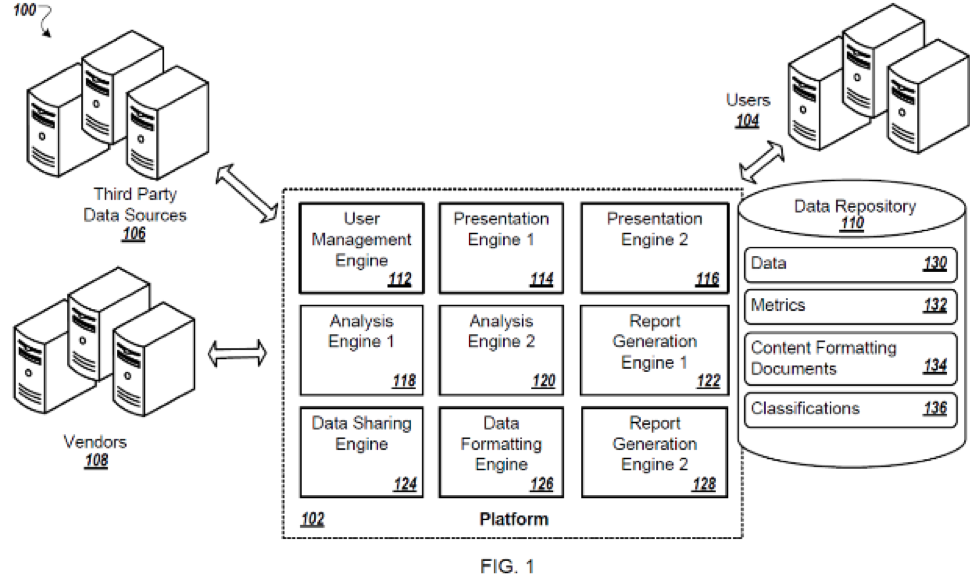
Who. Big data collection typically involves a number of players and extends beyond the applicant’s virtual “four walls.” When asking questions related to “who,” the practitioner gets an idea of sources of data or raw data pre-processing that are linked to the applicant’s infrastructure, collaborators in combining, finessing, or filtering the data, and recipients of outputs of the applicant’s innovation. In the example of smart automobiles, the “who” can include partners or vendors such as entertainment system providers, navigational system providers, or security component providers. In the example of big data mining of genomic data, the “who” can include any organizations, medical facilities, and/or universities that have contributed information to the applicant’s infrastructure. The “who” can include sources of de-identified data, confidential data, or paid data. The question of “who” begins the practitioner’s investigation into the applicant’s realm of control within the invention’s greater environment.
A system block diagram figure helps to lay out the various players within this environment by illustrating where inputs and outputs are fed into the applicant’s system by various contributors and/or receivers of information. In drafting claims, it is important to carve out roles to ensure that the claims cover the applicant’s activities within this environment while avoiding, as best possible, potential for split infringement. Remember to adapt for various permutations of the illustrated environment (e.g., the likely environmental distribution when applied by a university versus a corporation), in prose if not in alternative system diagram(s).
What. Source data and potential outputs related to big data analysis are often numerous and varied. The practitioner should delve into the kind of information and materials being provided by and/or to each entity identified above when establishing the “who” of the invention’s environment. The “what” can include various files or data streams encompassing data base fields, images, videos, sounds, or time-series of sensor outputs. The “what” can additionally include accepting biological materials or triggering application of medical interventions. The “what” may also include a state of the data such as raw sensor output versus a categorized result derived from the sensor data.
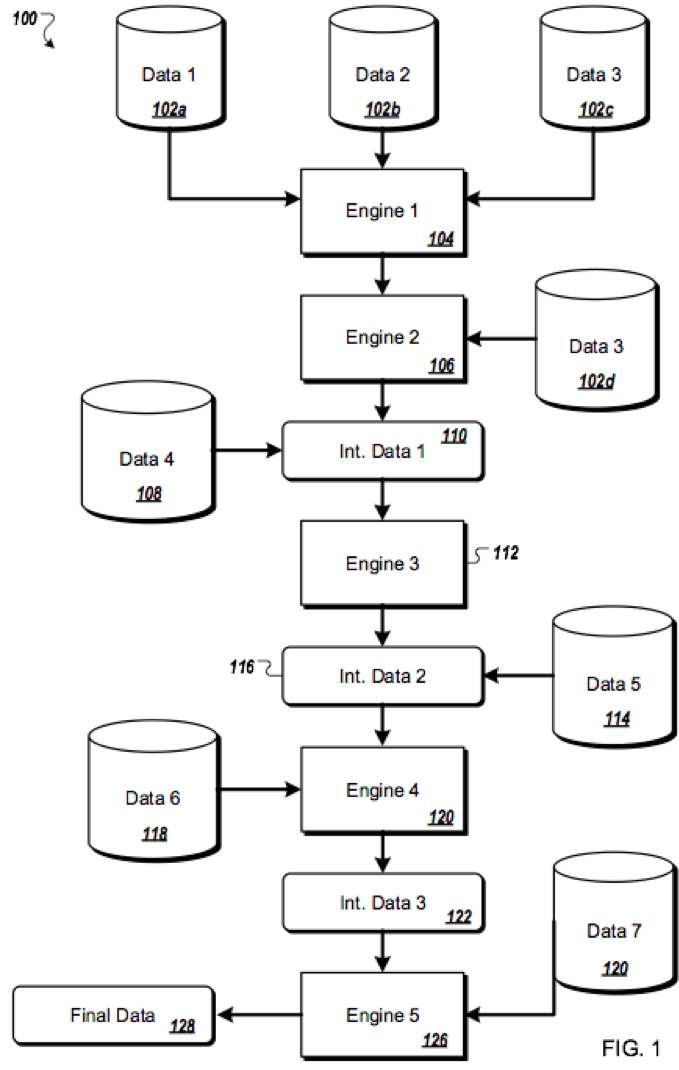
Imagine the big data analytics infrastructure as a factory where various assembly lines work to perform certain operations that contribute to the whole of the analytics outcome. To illustrate the hand-off of various information between entities within the environment, consider drafting an “operational flow diagram” having data sources and subsystems, engines, or algorithms connected with arrows overlaid by types of incoming or outgoing information or materials. An operational flow diagram can take the form of a pipeline or a simplified network of operations that results in one or more outputs. The infrastructure likely has a series of operational flows that work in parallel and/or feed into one another. Generally, in a particular operational flow diagram, the illustrated algorithms, engines, or subsystems receive various inputs, apply the inputs, and derive a result. The result may then be shifted elsewhere (e.g., through an outgoing arrow carrying output information) – for further analysis, for application as input to another engine, algorithm, or subsystem, or for temporary storage. Unlike a traditional flow chart, the operational flow diagram involves multiple actors collaborating to achieve a goal.
When. While programming began as a linear concept and many algorithms can still be represented as a linear series of events, operations today often occur in parallel and/or aperiodically based on a trigger. Further, processing can be shared among a number of processors or other devices. To illustrate, a medical or health device may perform a portion of analysis locally to ensure that timely information is provided to support a patient or owner of the device whether or not a networked connection exists, while more complex analysis may be reserved for performing in a remote environment (e.g., in the cloud). Additionally, some processing may be performed in real time while other processing may occur in the future after an abundance of real time processed data has been collected. In identifying the “when” or, better yet, different variations of timing of performance of the engines, algorithms, and/or subsystems within the environment, the patent practitioner determines where to be cautious in applying the historic linear model of algorithmic description. This does not mean that flow charts should be avoided. Instead, flow charts should include branches, decision points, and written description identifying that some steps may be performed in another order or in parallel – preferably with specific examples of alternative paths to obtaining the algorithm’s result.
The “when” question must be kept in mind not only during drafting, but also while crafting claim language. Genome analysis, for example, is not performed on “a processor” but instead performed in parallel across many processors in a computing farm or cloud computing environment to obtain results in a reasonable amount of time. Additionally, data mining techniques of historic biometric data collected from medical devices may apply evolving learning technologies to iteratively analyze collected data as additional information is received into the system. Here, it is important to understand when a triggering event occurs to produce a result or output information, and the claims should be drafted to avoid interpretations where all of the data is collected, analyzed, and results presented in a time-constrained fashion.
Where. Big data analysis is in essence collaborative. Information arrives from many sources, whether it is the DNA of a number of individuals, the driving habits of a number of drivers, or the negotiation process of a number of insurance agents. While very large applicants tend to collect and control large pools of data in-house, other entities may obtain, purchase, or access external data sources. Data contents and formatting of information obtained from third-party sources can vary. For example, some third-party sources may have conducted a “pre-analysis” on certain data or otherwise combined data into initial metrics. In illustration, while very large applicants often collect raw sensor data in-house and maintain the data under their control, potential infringers may only receive initial sensor analysis that combines raw sensor data (e.g., individual heartbeats) into a first level result (e.g., heart rate over time). Further, different systems may perform different stages of data analysis, possibly in entirely different geographic regions. In an illustration involving a medical device, pre-analysis may be performed on the device to provide real-time feedback to the user of the device, while higher level analysis may be performed at a remote location, such as a server system (e.g., periods of accelerated heartrate in view of time of day (e.g., morning, afternoon, evening, overnight). It is important to identify both where the applicant’s processing steps are taking place and where infringers’ processing steps could take place to reduce the invention to core steps that are most likely performed by a single infringer.
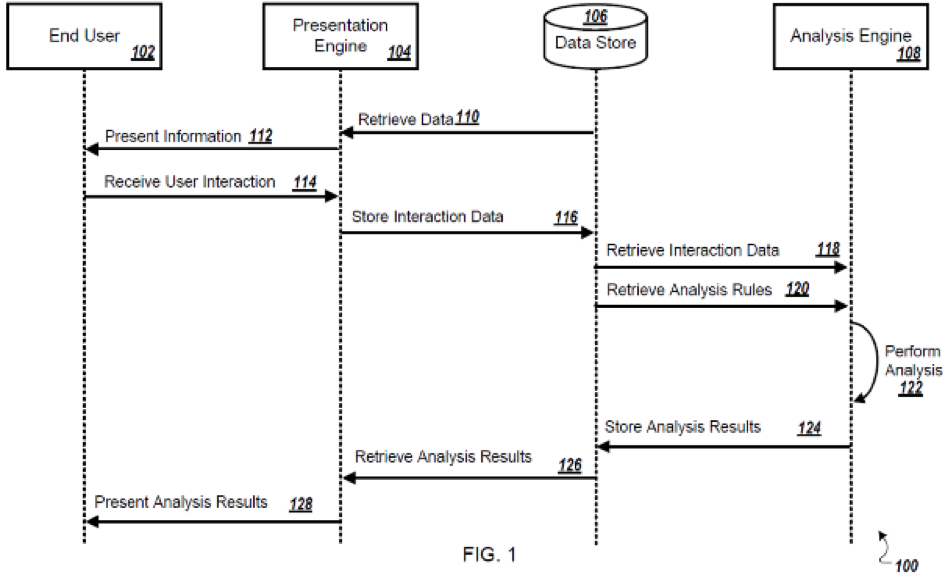
As an alternative to a single-source linear flow chart and in addition to the operational flow diagrams discussed above, “swim lane” diagrams are useful for illustrating triggering of processing and sharing of processing performance among distributed algorithms, engines, and/or subsystems. The swim lane diagram presents a number of operators collaborating together, such as engines or subsystems, with information flowing back and forth. In the detailed description, the prose can be structured to explain that the engines or subsystems can be geographically dispersed or contained within a single device.
Why. Asking “why” opens up a dialogue regarding the many avenues of alternate embodiments and work-arounds. “Why” should almost always be followed by “what if.” Example: “Why is the data structured this way?” Answer: “because of U.S. privacy laws.” “What if, instead, the commercial embodiment was designed for deployment in Europe?” A large organization may design a software system differently than a small organization due to the wealth of historic data and access to data sources available to the large organization. A system designed for a private sector customer may be structured differently than a system designed for a public sector customer. Lack of access to desired resources, such as faster computing systems, larger data storage, or lighter and longer running portable power sources, may direct today’s design in a manner that won’t affect potential infringers five or ten years down the road. Understanding why the client made the design choices that went into developing the commercial embodiment opens up the opportunity to describe alternative embodiments that could prove desirable to potential infringers and even the client in the future.
How. Here is where the seasoned life sciences or mechanical arts practitioner will feel on solid ground – all patent professionals are well versed on learning about the “how” of inventions. The one recommendation related to big data analysis is to ensure that you ask “how else?” At this point, we return to the prior topics. There may be different “wheres” (e.g., distribution of collection of data and/or analysis of the data to obtain results) depending on different factors or potential work-arounds. There may be different “whens.” Smaller entities may purchase or collaborate with a different organization to import data rather than having the data at their fingertips. There may also be different “whats,” or forms of output, based upon varying industry segments, entity sizes, or geographical regions. For example, the data, when obtained from an external party, may have a different formatting (e.g., de-identified so the identity of individuals from whom the data was collected has been lost). Once the practitioner has gathered all this information, it can be used to ensure that any algorithmic details are described broadly. While a certain learning algorithm may be best applied based upon the applicant’s desired output or the applicant’s type of incoming data, other types of learning algorithms may alternatively be applied if these factors are altered, while still remaining within the core scope of the invention.
Similar to a good detective having a network of informants, a good big data analytics prosecutor will benefit from developing a network of field experts for cross-collaboration in describing the applicant’s infrastructure. Not only can a software savvy patent practitioner and a life sciences savvy patent practitioner learn a lot from each other during collaboration, but this combined effort helps to ensure that the patent application is as complete, accurate, and robust as possible. It is always good to add a Watson to your Holmes when exploring new territory. Welcome to the exciting world of big data analytics applications. I hope the above description provides a solid map to help you on your way.